
Thinking about buying a home? Online maps can offer plenty of details about the major investment you’re about to make.
Let’s get started, because there’s much to map.
Mapping for Solid Property Values That Stand Up to Time
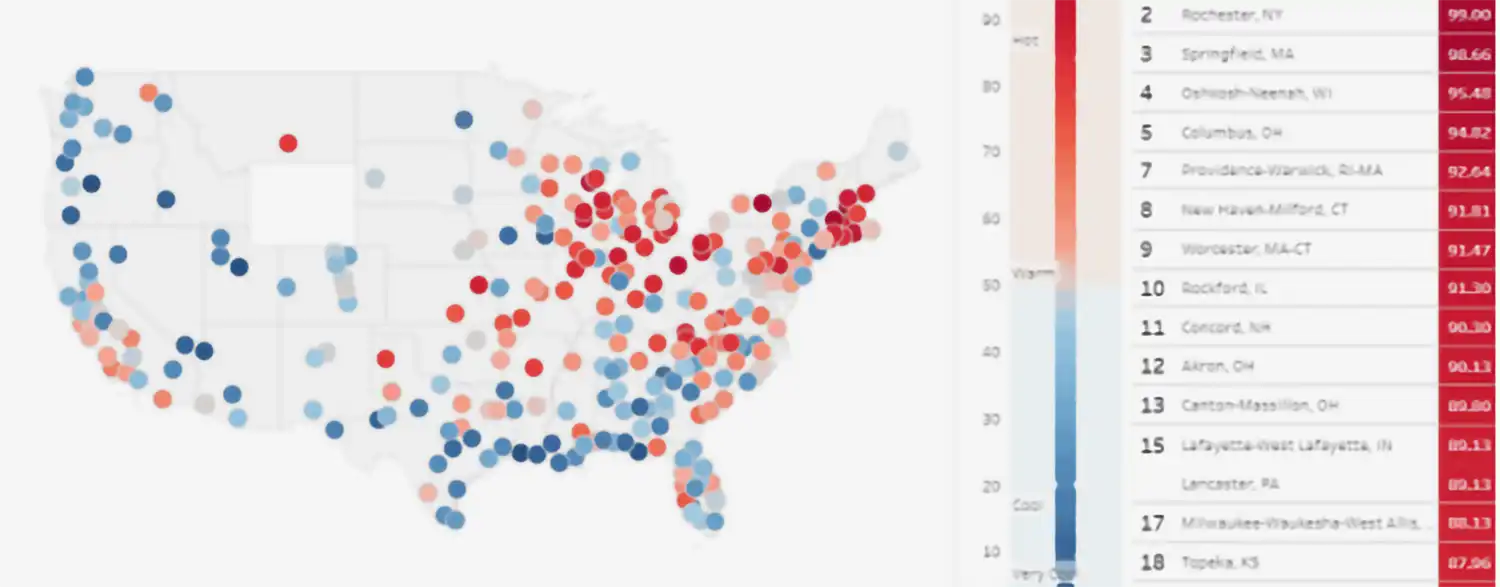
The Realtor.com® “hottest real estate markets” map is a powerful trendspotting tool.
As we go to press, The Realtor.com® market map shows Manchester, New Hampshire, Rochester, New York and Springfield, Massachusetts with today’s scorching-hot rankings. Slide the timeline back a while, and see how these real estate markets have held up over the years. This can give you a sense of property value (and property tax) appreciation.
Realtor.com’s tool checks the speed of home sales and how many listings are available in various locations. It covers the country from coast to coast. Check the current situation anywhere. Track trends — month to month, year to year. You can even see how many views a listing gets, relative to national averages.
The site also has a housing affordability section. Is the city you’re looking at more expensive than the U.S. average, or cheaper? The tool’s affordability scoring system can help buyers zero in on homes within their financial reach. It can also help sellers market their homes. Every month brings new data from the National Association of REALTORS®.
The National Map: Here Is the Lay of the Land

The U.S. Geological Survey (part of the Interior Department) offers a topographic map to show you the terrain. Run by the USGS National Geospatial Program (NGP), this mapping site can show you the contour lines representing an area’s peaks and valleys, its hills and gullies.
Topography involves mapping the land’s natural and artificial features. Topographic maps include the names and shapes of forests and rivers, mountains and valleys, plains and lakes… You get the picture. They show the buildings and infrastructure placed on top of these features, too. Developers use them. So can ordinary home buyers.
A topographic map can:
- Show how natural and built elements could affect construction and accessibility. Sharp sloping could make access difficult in winter, for example, which could impact curb appeal (literally!) to visitors or buyers.
- Help find current (or situate future) roads, boundaries, sewer and water pipes, solar panels, power lines, and so forth.
- Reveal the land’s gradual or sharp inclines, indicating how and where the water will flow or form ponds during and after a storm.
- Indicate low places where water runoff could lead to home damage over time, saturate the ground, or create an ongoing need for flood precautions.
- Uncover factors that impact property values as well as maintenance and insurance needs.
- Show where stormwater runoff can lead to tension for higher landowners due to the impact on nearby households. Help to inform decisions about what kind of drainage systems plus gardening or landscaping elements that prevent flooding.
- Give you an idea of the views and sunlight exposure for a particular home, as well as the degree of privacy it offers and its relationship to surrounding properties.
- Highlight possible hazards — the likelihood of erosion, landslides, or wildfires. This helps deed holders plan the placement of features to minimize dangers.
This mapping tool has much more of interest, too. It can even guide you through the history of the place. Learn historical features and names, as they’ve transformed through time.
Tools We Can Use: Risk Factor™ and Flood Factor®
Today, useful information about property risks is at our fingertips. The First Street Foundation Flood Model is one contributor to this information. We now can get instant flood risk information on any address from Risk Factor™.
FEMA might come to mind as a leading source of flood data. But the First Street Foundation is coming into the spotlight, bringing updated risk analyses to the public.
Although water inundation can happen anywhere, this is especially important for frequently flooded U.S. areas, such as the southern Gulf states, Vermont, Florida, and cities established along tidal rivers. Many of these areas aren’t covered by the older FEMA flood maps, so they don’t automatically get flagged as needing flood insurance. Yet they do flood. And even an inch of water in a home can cause $25,000 in structural damage, according to the National Association of REALTORS®.
The Flood Factor® tool anticipates flood risks from:
- Developing climate concerns, such as hurricanes and weather extremes.
- Stormwater runoff and storm surge risks.
- Predictions for sea level change.
The Flood Factor tool calculates property-specific water infiltration risks. The more general Risk Factor highlights dynamics that impact millions of deed holders.
Learn more about stormwater runoff with Deeds.com.
Using Other Maps to Find U.S. Housing Data—Or to Get the Feel of a Place
Initial research about markets and moving is greatly supported by online mapping options. Today we can use our computers to look at neighborhoods just to get a feel for places — even if we never actually go to some of these locales in real life.
You might take a look at Google. Its tools help the user map out and compare real estate markets. With Google’s Street View, the experience is like browsing shops and homes. The Satellite View option shows the land features. Zoom in, and you can even assess the state of local property maintenance! And Google Earth gives you virtual tours that feel like real ones.
Another mapping tool that may be of interest is the Hidden Housing map site. It’s a privately run, subscription-based tool, geared to help ordinary people zero in on appealing spots to search for homes for sale. The site’s “rankings” section shows counties, sorted by median listing price. Additional information relates to climate, rentals, and more. There are options to receive personalized data. Check the “about” section to email the developer for additional information.
Then have a look at City-Data. The City-Data.com mapping tools show all sorts of details for a given place: typical household incomes, popular attractions, the best ways to get there, and even the results of the latest restaurant inspections! You can compare stats for two cities at a time. There’s also an online forum to chat with others about any city-related question you might like to discuss.
These are just a few of the tools that can give a buyer an edge or an insight. Deeds.com is not affiliated with any of the abovementioned sites. We’re just looking! And we’ll look at others from time to time, so watch this space.
Supporting References
Realtor.com® from the National Association of REALTORS®: Market Hotness Index. See also: REALTORS® Affordability Distribution Curve and Score.
USGS.gov, part of the U.S. Department of the Interior: Educational Resources – Topographic Mapping.
Shailu Jaswal (agent of a Compass affiliate) via ShailuJaswal.com: Topography 101 – Why It Matters for Homebuyers and Real Estate Investors (2024).
Deeds.com: Safe or Sorry? The Evolving Law of Disclosing Flood Risk (and How to Look Up Your Own Home’s Risk of Flooding) (Oct. 11, 2023).
FirstStreet.org: Risk Factor™ / Flood Factor® Why a Property’s FEMA Zone Does Not Impact its Flood Factor.
And as linked.
More on topics: No real estate crash expected this year; Most affordable big cities
Photo credits: Screenshot taken of Realtor.com® on Jul. 19, 2025; and Linnaea Mallette via PublicDomainPictures (public domain).